Marketing Analytics: A 90-Day Playbook for Brands


Marketing analytics transforms your marketing from rear-view reporting into a revenue-driving decision engine. When you start with a testable hypothesis, track the metrics that connect spend to customer acquisition cost (CAC) and lifetime value (LTV), and build a repeatable measurement cycle, you can shift budget allocation and improve ROI within 90 days. SAS describes analytics as a forward-looking capability that enables forecasting and price optimization once historical data is centralized. Ready to see what that looks like in practice? Vainnewyork offers a pilot engagement to get you there fast.
What you’ll gain from this playbook:
A hypothesis-first framework that prevents data overload
Channel KPIs mapped to CAC, LTV, and ROI
A minimal tech stack you can stand up quickly
A 90-day milestone roadmap with roles and cost guidance
Ready-to-use templates and a pre-launch checklist
Pro Tip: Before opening any dashboard, write one sentence: “We believe [change] will improve [metric] by [direction] because [reason].” That single habit separates teams that act on data from teams that drown in it.
Table of Contents
What marketing analytics actually covers for creative teams
Marketing analytics is the practice of collecting, connecting, and analyzing data from every channel your brand touches, then using those findings to drive decisions, not just reports. The scope runs wider than most teams expect.
Core disciplines inside a mature analytics program:
Measurement planning: defining what you will track before a campaign launches
Data collection and tagging: capturing events accurately across web, app, and ad platforms
Attribution: crediting the right channels and touchpoints for conversions
Experimentation: A/B testing creative, offers, and landing pages to prove causation
Forecasting: projecting demand, CAC trends, and LTV curves from historical patterns
Governance: maintaining data quality, privacy compliance, and a single source of truth
Short use-case examples for creative and media teams:
A brand tests two hero video concepts in paid social; analytics reveals which drives lower CPL and scales that creative.
A content team uses web analytics for marketing to identify which blog topics convert readers into leads, then doubles production on those formats.
A media buyer compares ROAS across three channels and reallocates 30% of budget to the highest-performing one.
How to run a hypothesis-first analytics cycle
The biggest challenge in marketing data analysis is not access to data. It is having a clear question before you open any tool. Funnel’s practitioner guidance makes this explicit: start with a question, then segment to find repeatable patterns.
Write a hypothesis. Example: “Switching our paid social creative from product-feature ads to testimonial ads will reduce CAC by at least 15% within four weeks.”
Build a measurement plan. Define the conversion event, attribution window (e.g., 7-day click), and the data owner for each metric.
Collect and validate data. Confirm tags fire correctly; reconcile ad platform spend against your BI tool before analysis begins.
Analyze with context. Compare results year-over-year and use moving averages to separate real trends from short-term spikes.
Run an experiment. A/B testing and incrementality testing are the core techniques that prove causation rather than correlation.
Forecast and act. Once a pattern replicates, project forward and adjust budget or creative mix accordingly.
Pro Tip: Map every handoff in your cycle: creative lead owns the asset variant, the analyst owns the measurement plan, and the media buyer owns spend pacing. Ambiguous ownership is where most analytics programs quietly fail.
Which KPIs actually drive financial decisions

Distinguishing vanity metrics from business-impacting ones is the single most clarifying step a marketing team can take. Impressions and follower counts belong in awareness reports; CAC, LTV, ROI, and conversion rate by channel belong on executive dashboards.
Core financial metrics:
CAC: total spend divided by new customers acquired; your primary efficiency signal
LTV: projected revenue per customer over their relationship with your brand; pairs with CAC to show payback period
LTV:CAC ratio: a ratio above 3:1 generally signals a healthy acquisition model
ROI: (net profit / cost of investment) × 100; ties every campaign to a financial outcome
CPL (cost per lead): useful at the MOFU stage before a lead converts to a customer
Channel-level KPIs by funnel stage:
Stage | Channel | Primary KPI |
TOFU | Paid social, content | CPM, CTR, new session rate |
MOFU | Email, retargeting | Open-to-click rate, CPL |
BOFU | Paid search, direct | Conversion rate, CAC, ROAS |
Cadence recommendation: check tactical metrics (CTR, CPL) daily or weekly; review campaign KPIs monthly; assess LTV, payback period, and marketing performance tracking quarterly.
What data sources and tools you need to start
Supermetrics and SAS both recommend combining platform connectors with a BI layer for consolidated reporting. The goal is a minimal stack that delivers reliable analysis quickly, not a sprawling infrastructure project.
Primary data sources to connect first:
CRM (customer records, deal stages, LTV signals)
Ad platforms: Google Ads, Meta Ads (cost and conversion data)
GA4 (web behavior, session-level attribution)
Email platform (open, click, and conversion events)
Commerce platform (revenue, order value, repeat purchase rate)
Minimal viable stack:
Tool type | Purpose | Typical time to value |
Tag manager (e.g., Google Tag Manager) | Event capture and deployment | 1–2 weeks |
CDP or data layer | Unified customer identity | 2–4 weeks |
ETL/transform layer | Connecting and cleaning sources | 2–6 weeks |
BI/visualization (Looker Studio, Power BI) | Dashboards and reporting | 1–3 weeks |
Data cleanliness is the largest practical challenge. Small errors in tagging or source mapping break stakeholder trust faster than any insight can rebuild it. Validate before you visualize.
Your 90-day implementation roadmap
SAS recommends assessing analytics capability before selecting tools. The roadmap below follows that logic: capability gaps matter more than tool choice.
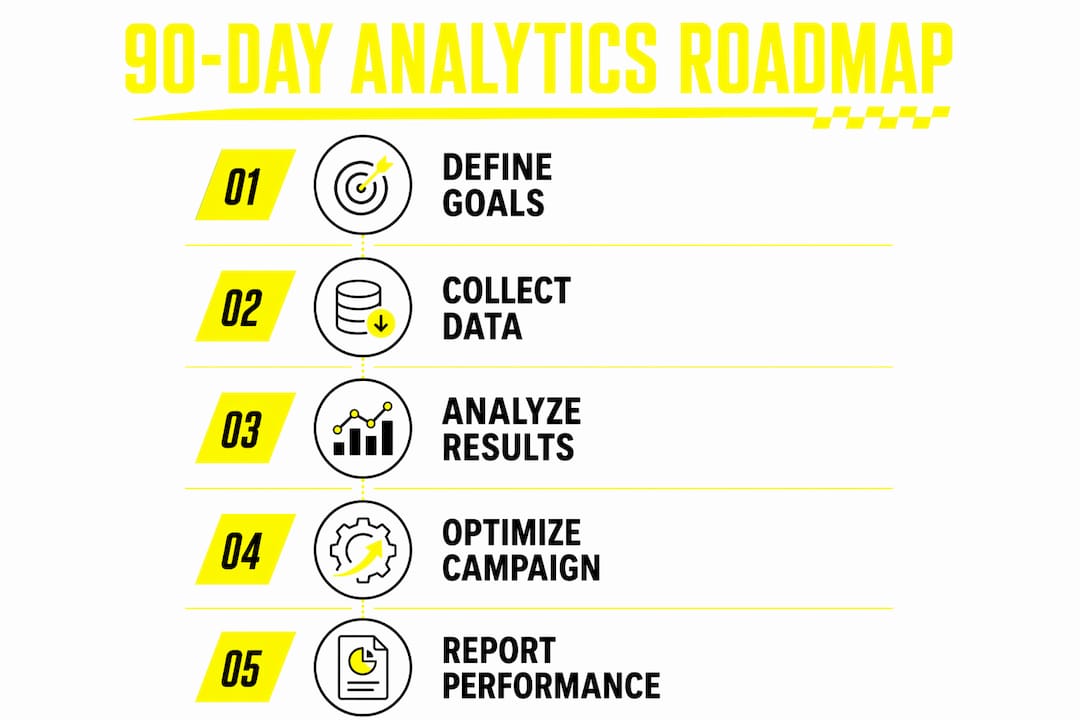
Weeks 0–2: Discovery. Audit existing data sources, identify tracking gaps, and document the one priority business question the pilot will answer. Owner: brand/product lead.
Weeks 3–5: Measurement plan and tagging. Write the measurement plan, deploy tags, and confirm events fire correctly in a staging environment. Owners: data engineer + analyst.
Weeks 6–9: Data centralization and QA. Connect sources to the BI layer, reconcile figures against platform native reports, and set up basic alerts for tracking breaks. Owner: data engineer.
Weeks 10–12: First analyses and experiments. Run the first hypothesis test, produce an initial dashboard, and present findings to stakeholders. Owners: analyst + creative lead + media buyer.
Ballpark expectations:
In-house pilot (existing team): 60–80 hours of analyst and engineer time across 90 days
Consultant-supported pilot: faster time to first insight, with a specialist handling tagging, QA, and measurement plan design
For brands exploring digital marketing strategies alongside analytics, aligning the roadmap to a live campaign creates the fastest feedback loop.
Who you need and how to keep data reliable
Harvard’s Marketing Analytics program frames analytics as a cross-functional leadership skill, not a single analyst’s job. Five roles make the program work.
Core roles:
Analytics owner/manager: sets the measurement strategy and owns stakeholder communication
Data engineer: builds and maintains the pipeline from sources to BI layer
Marketing analyst: runs queries, builds dashboards, and interprets findings
Creative lead: translates analytical findings into asset variants and production briefs
Brand/product stakeholder: approves hypotheses and acts on recommendations
Governance checklist:
Single source of truth defined and documented
Schema standards and naming conventions agreed upon before tagging begins
Tagging ownership assigned (who approves new events, who QAs after deploys)
Change-control process for tracking updates
Reconciliation cadence: weekly spot-checks, monthly full reconciliation
Pro Tip: Set a Slack or email alert for any conversion event that drops to zero for 24 hours. A broken tag is invisible until someone notices the data stopped. Automated alerts catch it in hours, not weeks.
Common pitfalls and how creative teams avoid them
The four failure modes:
Chasing vanity metrics: reporting impressions and likes to leadership instead of CAC and ROI
Reacting to short-term spikes: a single viral post or a holiday weekend distorts weekly averages; YoY comparisons reveal the real trend
Mismatched attribution windows: a 1-day click window will undercount a product with a 14-day consideration cycle
Siloed reporting: paid, organic, and email teams each reporting separately with no unified view of the customer journey
Practical fixes:
Run a hypothesis-first process so every report answers a pre-defined question
Use segment-level analysis (new vs. returning, channel cohort) rather than blended averages
Build a data reconciliation playbook: every dashboard figure traces back to a raw source
Pro Tip: For creative experiments, tie each asset variant to a single measurable outcome before production begins. “We’re testing whether lifestyle imagery reduces CPL versus product-only imagery” is a testable creative hypothesis. “Let’s try something fresh” is not.
Ready-to-use templates and checklists
Measurement plan template
Field | What to define |
Objective | The business goal this measurement supports |
Primary KPI | The one metric that determines success |
Event definitions | Exact event names, triggers, and parameters |
Attribution window | Click and view windows for each channel |
Data owner | Who is responsible for each source |
Hypothesis bank examples
“Replacing static ad creative with 15-second video will increase CTR and reduce CPL on Meta within 30 days.”
“Adding a testimonial module above the fold will increase landing-page conversion rate versus the current hero layout.”
“Shifting 20% of paid search budget to branded terms will improve ROAS without reducing total conversions.”
Pre-launch checklist
Tags fire correctly in staging and production environments
Sample data reconciles between GA4 and ad platform native reports
Dashboard figures match raw source exports
Attribution windows documented and agreed upon
Stakeholder sign-off on the measurement plan before campaign launch
How analytics changed real creative and media decisions
Case 1: Creative optimization. A brand running paid social noticed strong CTR on video ads but weak conversion rates. Segmenting by device revealed that mobile users converted at half the rate of desktop users. The creative team produced a mobile-first cut with a faster hook and a simplified CTA. Conversion rate on mobile improved meaningfully, and CPL dropped across the campaign.
Case 2: Channel reallocation. A content-driven brand tracked social media analytics across three platforms and found that one channel delivered five times the lead volume at a third of the CPL. Reallocating budget from the underperforming channel to the high-performing one reduced blended CAC without increasing total spend.
Case 3: Offer testing. A brand tested two pricing presentations for the same product: a single price versus a tiered bundle. Analytics showed the bundle increased average order value and improved LTV:CAC ratio. The key learning: LTV data, not just conversion rate, should inform offer design from the start.
What to do next
Your immediate checklist:
Pick one priority question your business needs answered in the next 90 days
Identify one data source you already have access to (GA4, CRM, or ad platform)
Assign a single owner for the measurement plan
Schedule a two-week discovery to audit tracking gaps and write the first hypothesis
Vainnewyork’s pilot engagement covers exactly this scope: a 4–6 week discovery, a complete measurement plan, and the first experiment designed and launched. We accelerate the 90-day roadmap by bringing creative, analytics, and media strategy together in one engagement, so you are not coordinating three separate vendors.
Pro Tip: The fastest way to build internal buy-in for analytics is to answer one question leadership already cares about. Pick the metric your CMO or CEO asks about in every meeting, and make that your first hypothesis.
Key Takeaways
Marketing analytics delivers its highest value when teams start with a testable hypothesis, centralize data from CRM and ad platforms, and track CAC and LTV as the primary financial signals.
Point | Details |
Hypothesis first | Write a testable question before opening any dashboard to prevent data overload. |
Track CAC and LTV | These two metrics connect marketing spend to financial outcomes and belong on every executive report. |
Minimal viable stack | Tag manager, CDP, ETL layer, and a BI tool like Looker Studio cover most brands’ needs to start. |
90-day roadmap | Discovery, tagging, data QA, and first experiments fit inside 90 days with clear role ownership. |
Vainnewyork pilot | Vainnewyork’s 4–6 week pilot delivers a measurement plan and first experiment to accelerate your roadmap. |
Analytics from the inside: a perspective from Vainnewyork
Most brands we work with do not have a data problem. They have a question problem. The dashboards exist, the platforms are connected, and the reports run every Monday. What is missing is the discipline to start with a single, testable hypothesis and hold every metric accountable to a financial outcome.
We have seen creative teams produce extraordinary work that never gets properly measured, and we have seen analytics programs generate beautiful dashboards that nobody acts on. The gap between those two outcomes is almost always a measurement plan written before the campaign launches, not after. When creative decisions and data decisions happen in the same room, at the same time, the work gets sharper and the results get clearer.
The brands that move fastest are the ones willing to run a small, honest experiment, learn from it, and build from there. That is the spirit behind everything we do at Vainnewyork.
Vainnewyork’s pilot: from question to first experiment
Brands that want to move from reporting to decision-making need more than a dashboard. Vainnewyork’s pilot engagement gives you a structured path: a 4–6 week discovery that audits your current tracking, a measurement plan built around your highest-priority business question, and your first creative or channel experiment designed and launched.
The pilot is built for brands that want creative and analytics working together from day one, not bolted together after the fact. You leave with a measurement plan your team owns, a live experiment generating real data, and a clear view of your CAC and LTV baseline.
Start your pilot engagement and let’s build something worth measuring.
Useful sources
What Is Marketing Analytics? | HBS Online — Foundational definition and ROI framework; best for leaders new to the discipline.
Marketing data analysis: 6 pro tips | Funnel — Practitioner-first guidance on hypothesis-first analysis and YoY comparisons; best for analysts and marketing managers.
Marketing Analytics: What it is and why it matters | SAS — Strong on forecasting, capability assessment, and the strategic shift from reporting to prediction.
Marketing Analytics: The Only Guide You Need | Supermetrics — Practical stack guidance, data blending, and incrementality testing; best for data engineers and analysts building the pipeline.
Digital Marketing Metrics | SEOTopSecret — Clear framework for distinguishing vanity metrics from financial KPIs; useful for anyone building an executive dashboard.
Marketing Analytics | Harvard Professional Development — Positions analytics as a cross-functional leadership skill; recommended for CMOs and brand leads seeking executive education.
Best marketing consultants in Kansas City | The Best KC — Useful reference for brands evaluating local consultant options and pilot staffing models.
Recommended
Comments