Return on Investment: How to Calculate and Judge ROI


Return on Investment measures how much profit you earn relative to what you spent, expressed as a percentage. The formula is: ROI = (Gain − Cost) / Cost × 100. Put $1,000 into a project, get $1,300 back, and your ROI is 30%. That single number tells you, at a glance, whether the effort was worth it financially.
Before you run the calculation, gather these inputs:
Proceeds: the total amount you received (sale price, revenue generated, or cash returned)
Cost basis: everything you paid to acquire or execute the investment (purchase price, production costs, platform fees)
Carrying costs: ongoing expenses during the holding period (maintenance, subscriptions, labor)
Income received: dividends, rent, coupon payments, or other cash flows earned along the way
Fidelity’s ROI explainer defines the metric as a percentage that compares gain (proceeds minus cost) against the original cost, making it one of the most portable financial measures in use today.
Table of Contents
What does ROI actually mean, and how does it differ from related terms?
ROI is a profitability ratio. A result of 25% means you earned $0.25 for every dollar you put in. A negative result means the investment lost money. The percentage form makes it easy to compare a $500 trade against a $500,000 real estate deal on the same scale.
Three terms often get used interchangeably, and the distinctions matter:
Return on Investment (ROI): — gain minus cost, divided by cost, multiplied by 100. The standard definition.
Return on Costs (ROC): Wikipedia notes that ROI is sometimes called Return on Cost and the two are functionally identical in most casual usage.
The critical point: ROI as normally calculated is not time-adjusted unless you explicitly annualize it. A 30% ROI over two years is not the same as a 30% ROI over six months, yet the raw number looks identical. Keep these short glossary items in mind as you work:
How ROI measures investment performance
ROI works as a profitability snapshot. The numerator (gain) captures how much value you created above your original outlay. The denominator (cost) anchors that gain to what you actually risked. Divide one by the other and you get a ratio that travels well across industries, asset classes, and project types.

The scope of what you include in each side of the equation shapes the result dramatically. Gross ROI uses total revenue in the numerator; net ROI subtracts all costs first. Neither is wrong, but mixing them when comparing two investments produces a meaningless comparison. The same logic applies to dividends: if you include them for one stock, include them for every stock you are comparing.
ROI is most useful as a first-pass screening tool. When a team is evaluating ten potential projects and needs to cut the list to three, ROI gives a fast, comparable signal. For a final capital allocation decision, you will want more, but as an opening filter it is hard to beat for speed and clarity.
Gross ROI: total revenue minus cost, divided by cost
Net ROI: (revenue minus all direct and indirect costs) divided by cost
Dividend-inclusive ROI: adds income received to the numerator
After-tax ROI: applies your effective tax rate to the gain before dividing
Pro Tip: Always decide on your scope before you calculate, and document it. If you define ROI as net-of-fees for one campaign, use the same definition for every campaign you compare it against. Scope drift is the single most common reason two analysts reach different ROI numbers from the same project.
How to calculate ROI step by step, with worked examples
The step-by-step checklist
Identify total proceeds. Add up every dollar received: sale price, dividends, rent collected, or revenue generated.
Identify total cost. Add the purchase price plus every fee, commission, tax, and carrying cost paid.
Subtract cost from proceeds. This is your net gain (or loss).
Divide by cost. This gives you the raw ratio.
Multiply by 100. This converts the ratio to a percentage.
Worked example 1: a stock trade
You buy 50 shares at $40 each ($2,000 total), pay a $10 trading fee, and sell a year later at $48 per share ($2,400), collecting $60 in dividends along the way.
Item | Amount |
Sale proceeds | $2,400 |
Dividends received | $60 |
Total proceeds | $2,460 |
Purchase cost | $2,000 |
Trading fees (buy + sell) | $20 |
Total cost | $2,020 |
Net gain | $440 |
ROI | 21.8% |
Calculation: ($2,460 − $2,020) / $2,020 × 100 = 21.8%
Worked example 2: a bond
You buy a $5,000 bond at par, receive $200 in annual coupon payments over two years ($400 total), and sell at $5,100.
Total proceeds: $5,100 + $400 = $5,500. Total cost: $5,000. Net gain: $500. ROI = $500 / $5,000 × 100 = 10% over two years.
Worked example 3: a small project
A marketing campaign costs $3,000 (agency fees, ad spend, and labor) and generates $4,500 in attributed revenue.

ROI = ($4,500 − $3,000) / $3,000 × 100 = 50%
Annualizing ROI for fair comparisons
When two investments have different holding periods, total ROI misleads. Calculator.net’s ROI tool supports this conversion directly. The annualized ROI formula is:
Annualized ROI = [(1 + ROI/100)^(1/n) − 1] × 100, where n is the number of years held.
Using the bond example above (10% total ROI over 2 years):
Annualized ROI = [(1.10)^(0.5) − 1] × 100 = 4.88% per year
That 10% two-year bond now compares honestly against a 5% one-year savings account.
After-tax and after-fees note: For a complete picture, apply your marginal tax rate to the net gain before dividing. If your gain is $440 and your tax rate is 22%, your after-tax gain is $343.20, giving an after-tax ROI of roughly 17% on the stock example above.
How do you know if your ROI is actually good?
“Good” ROI is always relative. A 5% annual return on a federally insured savings account is excellent for near-zero risk. The same 5% on a startup investment, where you could lose everything, is a poor trade. Three factors shape the benchmark: time horizon, asset class, and risk tolerance.
Rough benchmark ranges to orient your expectations:
High-yield savings / money market accounts: roughly 4–5% annually in the current rate environment (rates vary and change frequently)
U.S. Treasury bonds: historically 2–5% annually depending on maturity
Diversified U.S. equities: the S&P 500 has delivered a long-run average of approximately 10% annually before inflation, or roughly 7% after adjusting for inflation, though individual years swing widely
Small-business projects: internal hurdle rates commonly range from 10–20%, depending on industry and risk profile
Real estate: total returns vary by market, but combining appreciation and rental yield often lands in the 8–12% range over long periods
Inflation matters here. A 6% nominal ROI in a year when inflation runs at 4% leaves you with only 2% in real purchasing power gained. Taxes compress the number further. Always ask: what is the real, after-tax return?
Fidelity makes the point clearly: a higher potential ROI is almost always associated with higher risk. Investors who see a 40% projected ROI and read it as safety are misreading the signal. That premium exists precisely because the market demands compensation for the added uncertainty.
What are the real limitations of ROI?
ROI’s simplicity is its greatest strength and its most significant weakness. Investopedia identifies the core blind spot: ROI does not account for the time value of money, inflation, or opportunity cost. A dollar earned three years from now is worth less than a dollar earned today, and the basic formula treats them identically.
The most common ways ROI misleads:
Ignoring holding period: a 50% ROI over ten years is far less impressive than a 50% ROI over one year, yet the raw number looks the same
Treating high ROI as low risk: Fidelity’s guidance is direct on this point — higher potential return almost always signals higher risk, not safety
Omitting hidden costs: overhead, internal labor hours, platform subscriptions, and legal fees routinely stay off the cost side of the equation, inflating the result
Attribution errors: in marketing, crediting all revenue to a single campaign when multiple touchpoints contributed produces an ROI that cannot be replicated
Mixing gross and net figures: using gross revenue in the numerator while using net cost in the denominator creates a hybrid number that overstates performance
Practical adjustments that reduce these distortions:
Annualize every multi-year ROI before comparing it to anything
Calculate after-tax ROI for any investment where taxes materially affect the outcome
Build a full cost inventory before you calculate, including indirect costs
Run a sensitivity check: recalculate ROI with costs 20% higher and revenue 20% lower to see how fragile the result is
Pro Tip: Before presenting an ROI figure to a stakeholder, ask yourself: “What would this number look like if I included every cost and adjusted for the holding period?” If the answer changes the story significantly, the unadjusted number is not the one worth presenting.
Which metrics should you use alongside ROI?
ROI is a fast filter, not a complete analysis. Investopedia and the Corporate Finance Institute both note that professional investors treat ROI as a blunt first-pass instrument, then reach for NPV or IRR when time and cash flow patterns matter.
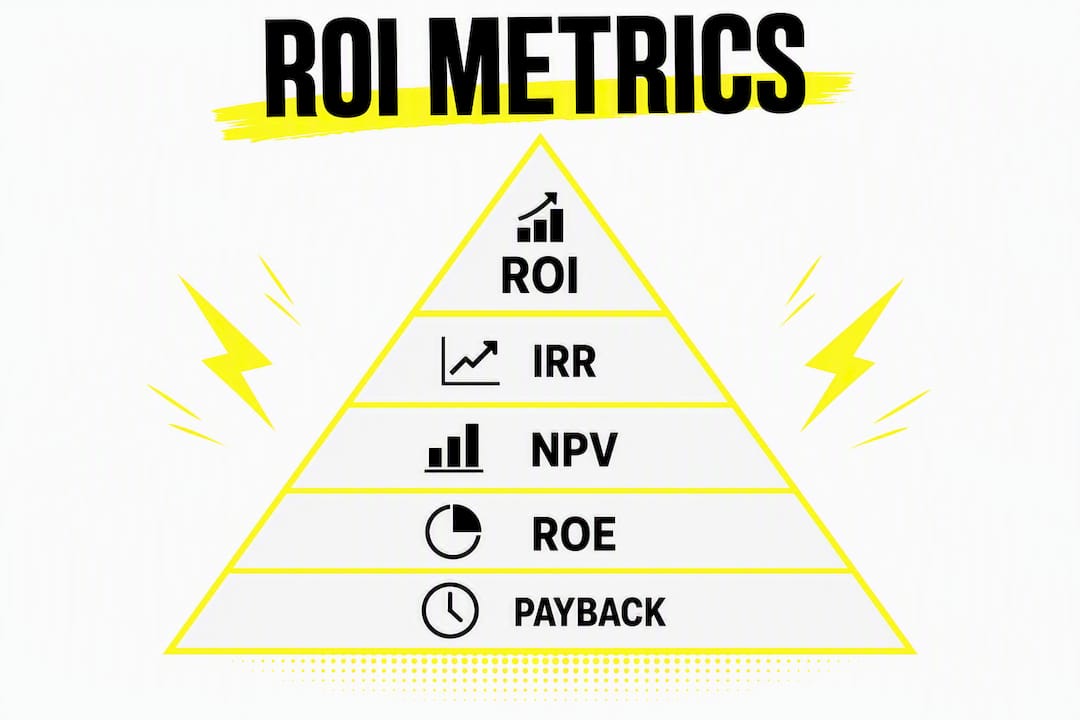
Internal Rate of Return (IRR) solves the time-value problem ROI ignores. It finds the discount rate at which the net present value of all cash flows equals zero. Use IRR when you have multiple cash flows spread over several years, such as a real estate development or a multi-phase production contract. A project with an IRR above your cost of capital is worth pursuing.
Net Present Value (NPV) discounts all future cash flows back to today’s dollars and sums them. A positive NPV means the project creates value above your required return. NPV is the preferred tool for capital budgeting because it gives you a dollar amount, not just a ratio, and it accounts for the timing of every cash flow.
Return on Equity (ROE) measures how efficiently a company generates profit from shareholders’ equity. It is most useful when comparing companies within the same industry, not for evaluating individual projects or trades.
Payback period tells you how long it takes to recover your initial investment. It ignores everything that happens after breakeven, so it is a poor standalone metric, but it is useful for liquidity planning and for projects where speed of recovery matters more than total return.
Metric | Handles time value | Handles risk | Best for |
ROI | No | No | Quick screening, simple comparisons |
Annualized ROI | Partially | No | Comparing different holding periods |
IRR | Yes | No | Multi-period projects, capital decisions |
NPV | Yes | Partially (via discount rate) | Capital budgeting, long-term projects |
ROE | No | No | Company-level equity efficiency |
Payback period | No | No | Liquidity planning, recovery speed |
The practical rule: use ROI to screen, use IRR or NPV to decide, and use payback period when cash flow timing is a constraint.
How do you apply ROI to stocks, real estate, and campaigns?
Stocks and bonds
For stocks, the inputs are: (sale price + dividends received) minus (purchase price + all trading fees). For bonds, replace dividends with coupon payments and add any premium or discount on the sale price. Fidelity specifies that each asset class demands its own input set, and mixing them produces a number that belongs to neither.
Real estate
Real estate ROI must include: sale price plus total rent collected, minus purchase price, closing costs, property taxes paid during ownership, insurance, and maintenance. Leaving out carrying costs is the most common error in real estate ROI calculations, and it can make a mediocre property look like a strong performer.
Marketing campaigns
A content marketing strategy built around measurable outcomes makes ROI calculation far cleaner. Here is a simple worked example:
Define the campaign cost: $5,000 (creative production, ad spend, and platform fees)
Attribute revenue: $12,000 in sales directly linked to the campaign via UTM tracking
Calculate: ($12,000 − $5,000) / $5,000 × 100 = 140% ROI
Adjust for attribution: if only 60% of those sales can be confidently attributed, recalculate with $7,200 in attributed revenue: ($7,200 − $5,000) / $5,000 × 100 = 44% ROI
The gap between 140% and 44% shows why attribution discipline matters more than the formula itself. For social media campaigns, where attribution is often partial, always present a range rather than a single point estimate.
Multi-year projects and recurring revenue
For projects that generate revenue over multiple years, calculate total ROI first, then annualize it using the formula from the calculation section above. Use IRR for any project with irregular cash flows, since annualized ROI assumes a steady compounding rate that rarely holds in practice.
Calculator tools: Calculator.net’s ROI calculator handles both simple and annualized ROI and is a practical starting point for quick checks before building a full model.
Common ROI calculation mistakes and how to avoid them
Even experienced analysts make these errors regularly:
Omitting fees and commissions: a $10 trading fee on a $200 gain changes your ROI by 5 percentage points or more on a small position
Mixing gross and net figures: using gross revenue against net cost, or vice versa, produces a number that cannot be compared to anything
Ignoring the time horizon: presenting a multi-year total ROI without annualizing it overstates the annual performance
Double-counting revenue: in multi-channel campaigns, the same sale can appear in the attribution reports of two or more channels simultaneously
Using anticipated ROI as actual ROI: HBS Online is clear that confusing projected ROI with realized ROI damages planning accuracy and produces faulty performance reviews
Verification steps worth building into your process:
Reconcile your cost figure against actual bank or card statements, not budget estimates
Run a sensitivity check with costs 20% higher and revenue 20% lower
Have a second person review the scope definition before you finalize the number
Pro Tip: Report ROI as a range, not a point. Present a base case, a conservative case (costs up, revenue down), and an optimistic case. A range communicates confidence intervals honestly and protects you when actuals diverge from projections.
Pro Tip: For content creation projects, log every hour of internal labor at a realistic hourly rate and include it in the cost basis. Excluding internal time is the most common reason creative project ROI looks better on paper than it performs in reality.
How to track forecast vs. actual ROI and report it credibly
The distinction between anticipated ROI and actual ROI is one of the most overlooked disciplines in financial planning. HBS Online frames it directly: confusing the two creates poor financial planning and faulty performance reviews. Anticipated ROI justifies a decision before it is made; actual ROI evaluates it after the fact.
A practical tracking process:
Document assumptions at the start. Record projected revenue, projected costs, and the time horizon before the project begins.
Lock the scope definition. Decide whether you are measuring gross or net ROI, and whether indirect costs are included.
Record actuals as they occur. Track fees, timelines, and revenue attribution in real time rather than reconstructing them at the end.
Calculate variance. Subtract actual ROI from anticipated ROI to identify where the model was wrong.
Feed findings back into the next forecast. Closed-loop learning is what separates organizations that improve their ROI estimates from those that repeat the same errors.
Item | Anticipated | Actual | Variance |
Total revenue | $12,000 | — | — |
Total cost | $5,000 | — | +$600 |
ROI | 140% | — | −65 pts |
The variance column is where the real learning lives. A 65-point gap between forecast and actual ROI points to either an attribution problem (revenue was lower than projected) or a cost-control problem (costs ran over). Knowing which one lets you fix the right thing.
For production management teams, building this table into every project close-out report creates an auditable record that supports both internal learning and client transparency.
Key Takeaways
ROI is most reliable when you define scope before calculating, annualize for fair comparisons, and pair it with NPV or IRR for any decision involving multiple cash flows or a long time horizon.
Point | Details |
Use the core formula | ROI = (Gain − Cost) / Cost × 100; include all fees and income in each side. |
Annualize multi-year returns | Use [(1 + ROI/100)^(1/n) − 1] × 100 to compare investments held for different periods. |
Benchmark against asset class | A “good” ROI depends on risk and time horizon; equities average roughly 10% annually before inflation. |
Pair ROI with IRR or NPV | ROI does not handle time value of money; use IRR or NPV for multi-period or capital budgeting decisions. |
Separate forecast from actual | Document anticipated ROI before a project starts and calculate actual ROI after it ends to improve future estimates. |
Why ROI thinking shapes every creative project we scope
At Vainnewyork, we treat ROI not as a finance department metric but as a creative discipline. Every project we scope starts with a simple question: what does success look like in numbers, and what will it cost to get there? That framing changes how we build budgets, how we structure deliverables, and how we report results to clients.
What we have observed across creative and media projects is that the biggest ROI errors are not mathematical. They are definitional. A brand will approve a campaign based on a projected 200% ROI, then measure the outcome against a different revenue figure than the one used in the projection. The math is fine. The scope shifted. That gap between anticipated and actual ROI is almost always a communication failure, not a calculation failure.
Our recommendation for any brand or agency reader: build your ROI framework before the project starts, not after. Define what counts as revenue, what counts as cost, and what attribution method you will use. Lock those definitions in writing. When the campaign ends, the variance analysis writes itself, and the conversation with stakeholders stays grounded in shared assumptions rather than competing spreadsheets.
The media mix decisions that drive the strongest long-term returns are rarely the ones with the highest projected ROI. They are the ones where the measurement framework was clear enough that the team could learn from the result, adjust, and do better the next time.
Useful sources and further reading
These are the primary references used throughout this article. Each covers a distinct aspect of ROI methodology and is worth consulting for deeper reading.
Fidelity: How to Calculate ROI — practical formula guidance, asset-class-specific input lists, and a clear discussion of the risk/return relationship
Investopedia: What Is Return on Investment (ROI)? — covers limitations, time value of money, and when to use NPV or IRR instead
HBS Online: How to Calculate ROI to Justify a Project — focuses on anticipated vs. actual ROI and project-level worked examples
Corporate Finance Institute: What Is Return on Investment (ROI)? — strong on benchmarking, alternative metrics, and corporate decision-making context
Wikipedia: Return on Investment — terminology distinctions (ROC, ROR) and a broad overview of usage across industries
Calculator.net: ROI Calculator — free tool for both simple and annualized ROI calculations; useful for quick checks before building a full model
This article is general financial information, not professional investment advice. Confirm current rates, tax rules, and regulatory requirements with a qualified financial advisor or the relevant primary source before making investment decisions.
Recommended
Comments